🏫 Introduction:
Graphing is one of the most fun ways for kindergarten and early grade 1 students to explore numbers and data!
In these Picture Graph Worksheets, children count pictures of everyday objects—like fruits, toys, or insects—and color the bars to show how many of each item there are.
This hands-on math activity helps kids learn:
How to count and group objects
How to represent data visually
How to compare which item has “more” or “less”
Each worksheet is designed with cute, clear illustrations that make learning engaging and enjoyable!
✏️ What’s Included:
Your Level 1 download includes:
🐝 Insect Picture Graph – Count bees, butterflies, and ladybugs, then color the bars.
🍎 Fruit Picture Graph – Count apples, bananas, and pineapples to show how many of each.
🚗 Toy Picture Graph – Identify and color cars, balls, and blocks.
🧢 Picture Graph – Sort and color caps, bags, and spoons.
👉 Each page includes two activities per sheet so teachers and parents can save paper while giving students extra practice!
🎯 Skills Practiced:
Counting familiar everyday objects
Coloring and representing data visually
Comparing quantities (more/less)
Developing observation and math readiness skills
These activities make early math learning hands-on, creative, and fun!
💡 How to Use:
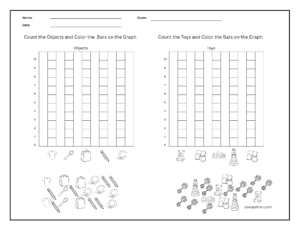
Print the worksheet (ideal in black-and-white for coloring).
Ask children to count each object type.
Color the matching number of boxes on the bar or picture graph.
Discuss which object has the most or the least.
Perfect for math centers, home practice, or classroom lessons!
📥 Download the Picture Graph Worksheets

👉 Download Object and toys Picture Graph Worksheets (PDF)
👉 Download Insects and Fruits Picture Graph Worksheets (PDF)
🔗 Explore More Graph Activities:
🧠 Teacher Tip:
Encourage children to talk about what they observe in the graph — for example,
” I see 5 caps and 3 fruits. There are 2 more caps than fruits!”
This simple conversation builds critical thinking and oral math language.
Picture graphs are also introduced in many early math programs.
To learn more about pictographs and examples, visit:
👉 Math Is Fun – Pictographs
https://www.mathsisfun.com/data/pictographs.html
Each worksheet is designed with simple, clear illustrations that make learning engaging and enjoyable!
✅ FAQs – Picture Graph Worksheets for Kindergarten
1) What is a picture graph?
A picture graph (also called a pictograph) is a simple chart that uses pictures or symbols to show data. Instead of numbers alone, children count pictures to learn how many items are in each group. It’s an easy and fun way for young learners to understand information visually.
2) Why are picture graphs important for kindergarten students?
Picture graphs help children build early math skills. They:
-
Encourage counting and sorting
-
Teach how to organize information
-
Help kids compare groups (more/less)
Learning picture graphs lays the foundation for bar graphs and data interpretation in later grades.
3) How do I use these picture graph worksheets at home or in class?
Print the worksheet and ask children to:
-
Count each type of object
-
Color the matching number of boxes or bars
-
Compare which object appears the most or the least
These worksheets work well for independent practice, math centers, small groups, or homework.
4) Are these worksheets suitable for early learners or struggling students?
Yes! The worksheets use simple pictures of everyday objects, making them easy to understand. They are ideal for:
-
Kindergarten students
-
Early Grade 1 learners
-
ESL students
-
Children who need extra visual support
5) Do I need any special supplies to complete these worksheets?
No special materials are required. All you need is:
-
A printed worksheet
-
Crayons or markers
Optional: pencils for extra practice.
Everything else is built right into the page for easy use.
6) Why use a 2-in-1 picture graph worksheet?
A 2-in-1 worksheet includes two activities on a single page.
This format offers several benefits:
-
Saves printing cost and paper
-
Gives students extra practice in one sitting
-
Helps build confidence by working on similar tasks side-by-side
-
Makes it easier for teachers to assign quick practice during class
With two coordinated activities together, children stay engaged longer and get more opportunities to count, compare, and color data — all without needing multiple sheets.